Like most websites, we use own and third party cookies for analytical purposes and to show you personalised advertising or based on your browsing habits.
Generally, the information does not directly identify you, but can provide you with a more personalised web experience. Because we respect your right to privacy, you may choose not to allow us to use certain cookies. However, blocking some types of cookies may affect your experience on the site and the services we can offer.
For more information, you can read our cookie policy.
Twitter Analytics with metricool
You can analyze the performance of your digital marketing strategy on multiple social platforms with Twitter Analytics Metricool.
One of them is Twitter, and with Metricool you can measure and understand the performance of your posts to improve your social strategy and get better results.
Here’s a demonstration of our metrics!
Community
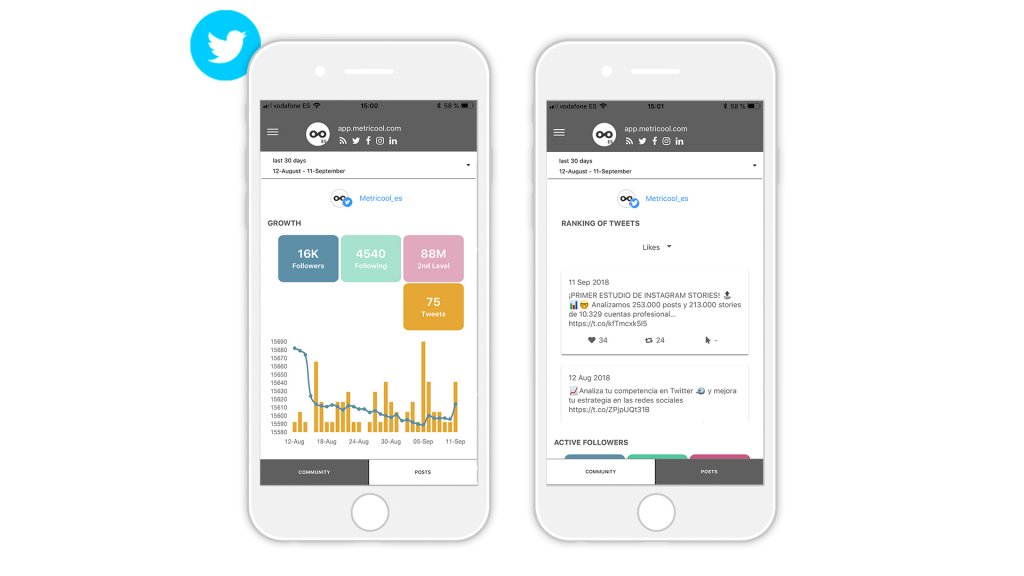
The first thing you see on the Evolution dashboard after connecting your Twitter account to Metricool is the growth chart of your community.
Growth of your community on Twitter
With this data, you can know how your audience has evolved on Twitter, that is if it has increased or decreased in followers, the number of tweets you have published in a specific period, the followers you have gained per day, and the people you follow.

You can draw different conclusions from this data:
▶️ Does your activity on Twitter affect your number of followers?
▶️ Are the days you have gained the most followers the days you have published the most?
Balance of followers
After analyzing the growth of your community and drawing interesting conclusions, you can continue researching your community by looking at your account’s balance of fans.

▶️ A balance of your followers: how many you gain and how many you lose each day. This data will allow you to observe how your community evolves in relation to the frequency of your publications.
▶️ A profile of the Twitter account that has or has not followed you.
Analysis of your tweets
You can obtain valuable information about your community and followers, and also analyze the performance of your tweets:
Tweets summary
The first interactive graph shows a summary of your tweets. Here you will find the 4 basic metrics:
✅ Engagement: Interactions/Impressions x 1000.
✅ Impressions of the tweets of the period, both organic and promoted.
✅ Interactions: i.e. likes, retweets, replies, quotes, clicks on your links and profile.
✅ Tweets

Interactions and tweet ranking
Here you can check the interactions received by the posts published in the chosen time range, such as:
✅ Number of Likes
✅ Number of Retweets
✅ Number of quotes
✅ Number of replies
✅ Number of Link clicks
✅ Number of profile clicks
✅ Number of tweets published

You can also analyze more specific data:
- Daily likes and likes per tweet
- Daily retweets and retweets per tweet
Type of tweets
Here you will find two doughnuts:
The first one shows the number of tweet types you have published in the chosen period. You can choose between original tweets, retweets, and replies. You can also check this information in a table.
In the second doughnut, you can discover if you have had a greater impact with your organic tweets or with the promoted ones.

Ranking of posts
Table where you can see all the information about your posts.
This table can be sorted by the metric you want and analyze your content with all this information:
- Likes
- Retweets
- Quotes
- Impressions: How many times the Tweet has been viewed (not unique per user). A view is counted if any part of the Tweet is visible on the screen.
- Replies: How many times the tweet has been replied to.
- URL link Clicks: number of times a user clicks on a URL link or a URL preview card in a Tweet.
- User profile clicks: The number of times a user clicks on the following parts of a tweet; display name, user name, profile picture.
- Video views: How many times the video included in the tweet has been viewed.
- Engagement: Interactions/Impressions x 1000
Analyze your competition on Twitter
Add your competitors to discover how they are performing on Twitter. You will have the following data:
- Followers
- Following
- Number of Tweets
- Average Likes per tweets published in the period selected
- Average Retweets
- You can sort your competitors by the metrics that interest you most.

Metricool App
Here are the links to download the application, all your data is in your pocket.

Twitter Report
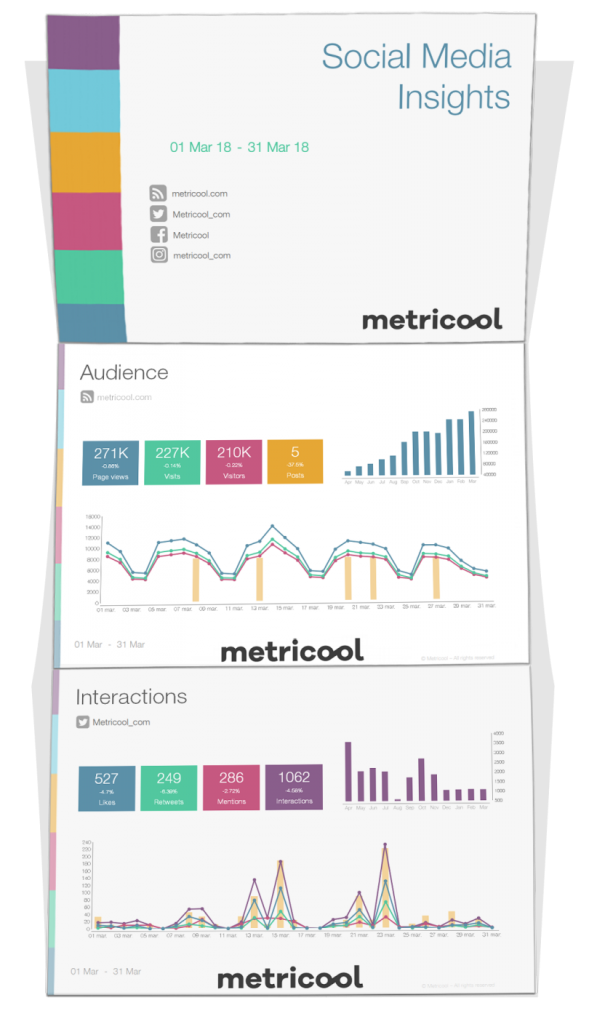
This is one of the most important advantages that you will obtain with Metricool in comparison with other tools. Metricool helps you create Social Media Reports automatically in PDF or PPT format, offering Twitter metrics in great detail. The result will be very professional and with an attractive design.
These reports can be presented to your clients or superiors, or simply show the information to potential sponsors or advertisers.
Besides the high level of professionalism, the reports will help you track your strategies and objectives.

On top of this, these Social Media Reports can be customized with options like:
- Interval of time that you want for your report.
- Metrics and sections that you want to show.
- Logo of your company or agency (it will appear at the bottom of each page)
- All Twitter analytics in one tool that will save you time and probably also some headaches with your metrics.
Twitter Benchmarking
At your disposal in this section is all the info about your posts, interactions, a community of followers, and people you follow in real time. At the same time, you can compare this data against the competitors you choose. That is, Twitter Benchmarking.
You can perform an analysis in real time about your community of followers and following, showing the relationship between both groups. You’ll also be able to see how much they overlap.

There is a lot to learn about your competitors and their strategy on Twitter. What they are doing well and what they are not. Find out the followers you share and your common ground. The real-time analysis allows you to add one competitor to establish a comparative. With this feature, you can figure out who has more interactions or the type of posts that your competitor uses (original tweets, retweets or if they share many links or images). So, with this info, you can prepare a strategy to:
- Attract new followers that you are interested in.
- Learn what works better for them.
- Know the type of strategy they use with their own followers.
Knowing your competitors well is crucial, you don’t have to copy them but it’s important to understand how they perform and why.

