

Like most websites, we use own and third party cookies for analytical purposes and to show you personalised advertising or based on your browsing habits.
Generally, the information does not directly identify you, but can provide you with a more personalised web experience. Because we respect your right to privacy, you may choose not to allow us to use certain cookies. However, blocking some types of cookies may affect your experience on the site and the services we can offer.
For more information, you can read our cookie policy.
What is Twitter Analytics and how to use it?
Twitter Analytics’ objective is to show the performance of your posts, and moments on Twitter. It was launched in 2005 in order to be a transparent network and allow its users to measure reach and metrics to make better decisions in their Twitter marketing strategy.
What is Twitter Analytics?
It is the free tool that Twitter offers to measure the data and performance of your content on Twitter: posts, community, multimedia elements, moments or ads.
This data provides you information that you can interpret to analyze what content is working in your account, which posts you should put your efforts on, and how your work progresses on the social network.
How Twitter Analytics works
There are two ways to access Twitter Analytics. Both are free.
➡️ Through this direct link: Twitter Analytics.
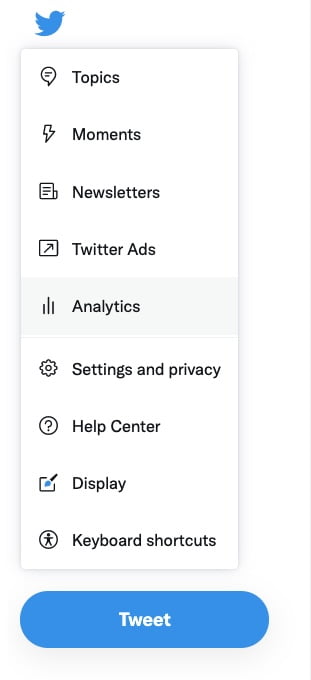
➡️ From your computer on the left sidebar, click on “more” and then select “analytics”.
You just have to log in with the account you want to analyze. The app takes you directly to the account with which you are connected.
It’s very straightforward: as soon as you enter, it already offers you a first view of the statistics of your Twitter account.
If data does not appear on Twitter analytics it may be for several reasons.
- Your account is in violation of Twitter’s terms of use.
- Your account was created less than 14 days ago.
- Your account is suspended, restricted or suspended.
What information does twitter analytics offer you?
✅ Summary of the last 28 days.
The first information you have in hand summarizes the last 28 days of your activity.
Here you can see the number of tweets posted in that period, impressions, profile views, mentions, and followers.
In addition, this info is compared with the previous 28 days, indicating if it has been better or worse. It,s an amazing way to get an overview of your Twitter performance.
On the left, you can find “tweet highlights“, which include information about : Top mention, top followers, top media tweet, top tweet, top card tweet.
✅ Summary of each month
In the second section, you have information about the best moments of your Twitter profile in that month: the tweet that generated more impressions, the mention that has obtained the most engagement, the most active follower, and the most impacting tweet with multimedia elements..
In addition, on the right side, you have a summary of your activity so far: published tweets, total impressions, profile visits, mentions, and new followers.
✅ Tweets Summary
If you click on view tweet activity, Twitter gives you a detailed analysis of each of your tweets.
You can filter them by published tweets, the most popular ones, which ones had any reply, or promoted ones. In each of the tweets, you can see the impressions, engagement, and ratio of each tweet.
You also have detailed information on engagement: likes, retweets without comments, responses, and clicks on links.
You can download this data in a CSV file, both tweet by tweet and per day.

How to view individual tweet activity?
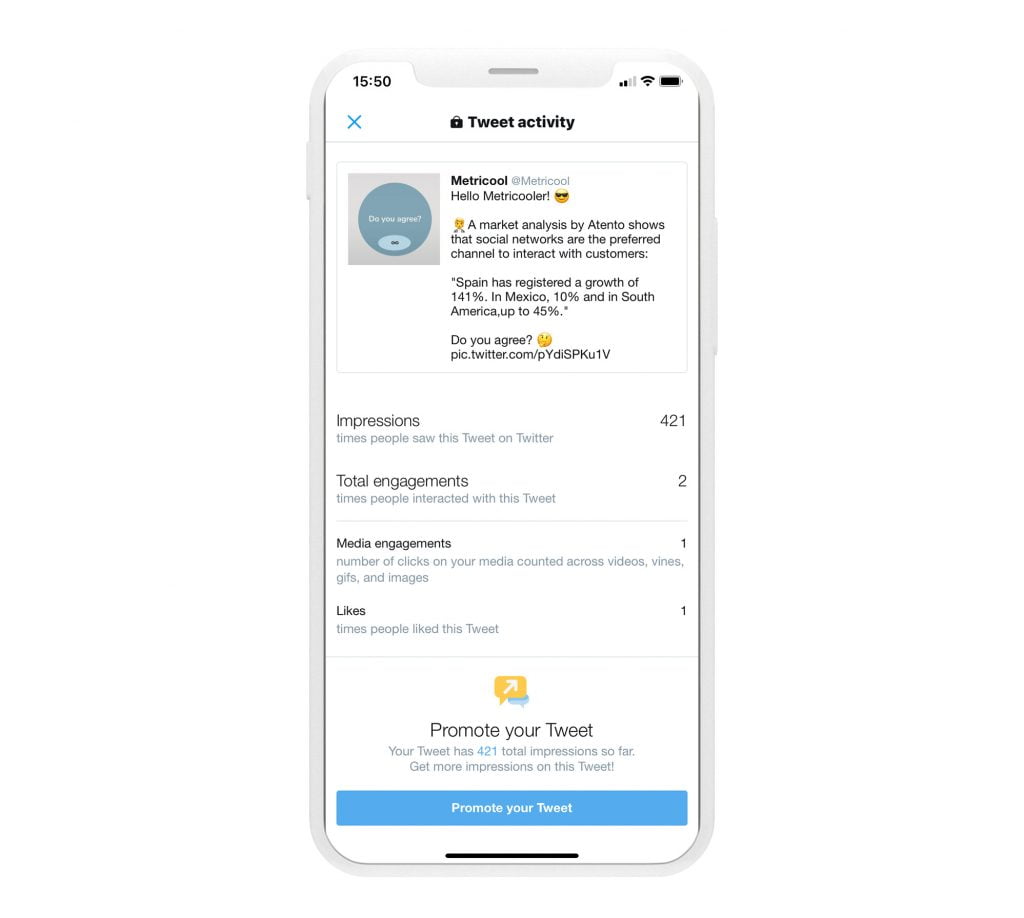
Another option to know how a tweet has worked in detail is to go to the post and click on the graphics button located at the bottom right.
When you click, it shows you impressions, the average, and the total engagement, the times they have seen the tweet’s details, likes, clicks on the profile, replies, or retweets.
This is how you can see the results obtained in your Twitter account at any time, marking the dates you want to see it and downloading it in CSV format if you need it.
And, if in addition to checking your performance, you want to publish automatically, analyze competitors or know who has followed and unfollowed you. We have the solution.
Benefits of Twitter Analytics
What are the advantages of having this information for your Twitter profile?
Measure the impact of your content
Using a tool to analyze your Twitter content allows you to measure your posts’ impact on your community.
What content is working best, what time you are more active, what tweets generate more interaction, etc.
✅ What benefit does it bring?
Plan your content strategy in the short and long term, promoting the one that works best for you.
Understand your audience
By looking at the results of each type of tweet, you get to know your audience better, and you can find out what they like about your profile.
This data can be obtained from the analytics of each tweet individually: the impressions they generate, responses, likes, and other interactions.
✅ What benefit does it bring?
Knowing your audience is the first step in achieving a content strategy that generates positive interactions with your profile, giving your community the content they are looking for and need.
Analyze the results of your ads
Have you run any ad campaigns on Twitter? If the answer is yes, you have to analyze the results you have obtained.
After all, Twitter is free, but you are investing money in your campaigns. Making an investment without rhyme or reason or measuring the results can waste money and time.
✅ What benefit does it bring?
Compare the different campaigns that you have carried out to know which ones work best, which tweets to promote, and understand what results you are obtaining with your investment.
Metricool as an alternative to Twitter Analytics
With Metricool, you have access to the data of your Twitter account once you register for free on the platform.
And, it also allows you to schedule your tweets, configure the RSS feed for automatic publications, measure hashtags, analyze competitors and obtain reports without historical limits.
What information does Metricool offer you about your Twitter account?
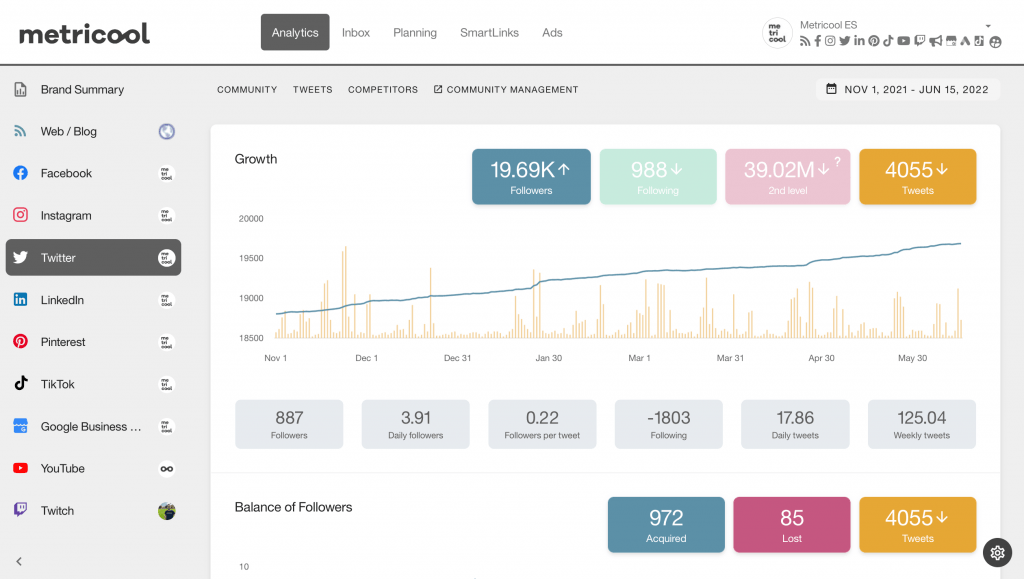
✅ Community
A complete analysis of the community of your Twitter account is divided into three sections.
Growth → In the first section, you can see the evolution of your followers, the profiles you follow, and the number of tweets published.
Balance of followers → Secondly, you have a balance of followers, gained and lost. In the next section, you can see detailed information of the followers gained and lost: number of followers, username, and @.
Mentions → Finally, you have the number of mentions you have received in the period you have selected and per tweet or daily.
✅ Tweets
The impact of the content of the tweets you have published, in general, and in detail.
In the summary, you can see the engagement obtained, the impressions, interactions, and the number of tweets.
The interactions that your tweets have generated: likes, retweets, replies, quotes, and clicks on the profile and links.
Below, you can find a graph with the types of tweets (original, replies and retweets) and impressions divided between organic and paid.
Finally, you have a list of all the tweets you have shared in that period, detailed in date, impressions, likes, replies, retweets, and quotes. You can click to see the post on the social network or copy the text to publish it again from this list.
✅ Competitors
This feature allows you to add profiles that are competitors in the same niche and analyze their performance.
You can see their followers, the profiles they follow, the number of tweets, likes or retweets. A way to see the results they get and compare them with yours.
You can download this information in CSV or view it on the platform itself.
✅ Hashtags tracker
Can you measure the impact of a hashtag created for a specific event? Yes, with Metricool you have this function to monitor the impact of a specific hashtag.
It’s easy to use: you choose the hashtag, start date, time, and duration.
Once finished, you have the information of the number of tweets that include that specific hashtag. You can also see the number of participants, the impressions achieved, the language, and the profiles of the participants.
A useful tool if you usually use hashtags in your content to promote an important event or date.
✅ Unlimited historical reports
You can collect all this information and have it organized to present to the brand you work for or if you want to show it as a media kit.
With Metricool, you can create a report in PDF or PPT with all the information that you have obtained on Twitter in a specific time. Also you can customize it with your brand colors or your logo.
With this report you have the results of your profile properly organized and ready to prove your worth as a ‘content creator’ on Twitter.
Do you want to take the first step in your marketing strategy on Twitter?
Get started with this Metricool’s Twitter step-by-step guide.